California Drought Impact (opens in new tab) 2016, rebuilt 2026
This began as my research-assistant job at Cal State Fullerton. Yoon Chung Han designed it as a data artwork, with laser-cut sculptures, projection mapping and a D3 page. I wrote the code, and we showed it at ISEA 2017 in Manizales, Colombia.
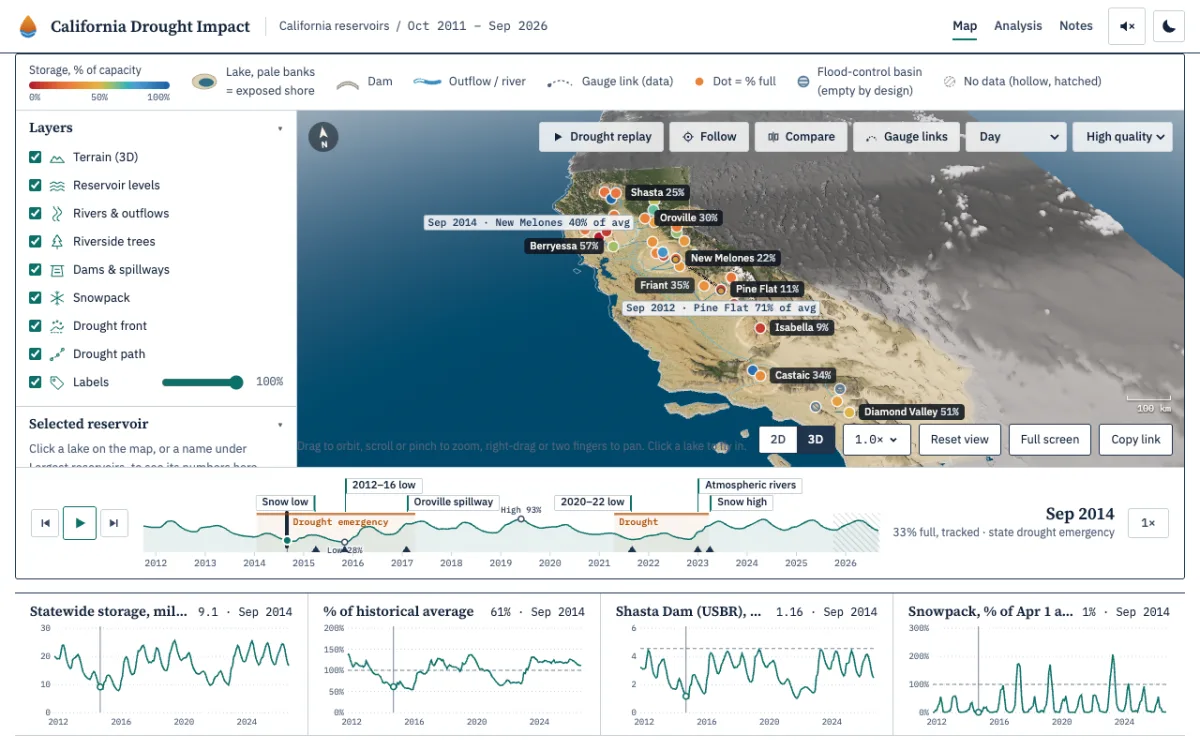
This year I rebuilt the page. The 2016 version had a single storage snapshot, September 2014, with a lot of blanks. The new one has monthly storage for 34 reservoirs from October 2011 to September 2026, pulled from CDEC, on a 3D relief of California where a low lake shrinks and shows its bathtub ring. The data needed the most fixing: months missing on CDEC, capacities that had been revised since 2016, and two flood-control basins on the Santa Ana River that are kept nearly empty on purpose and had to come out of the totals.
Open the map (opens in new tab) The 2016 version (opens in new tab) Code (opens in new tab)